
Find deploys that failed, regressed or lack evidence
Open an environment’s Deploys tab to find deployments that need attention in the displayed time window. Use the summary to narrow the rows you inspect.
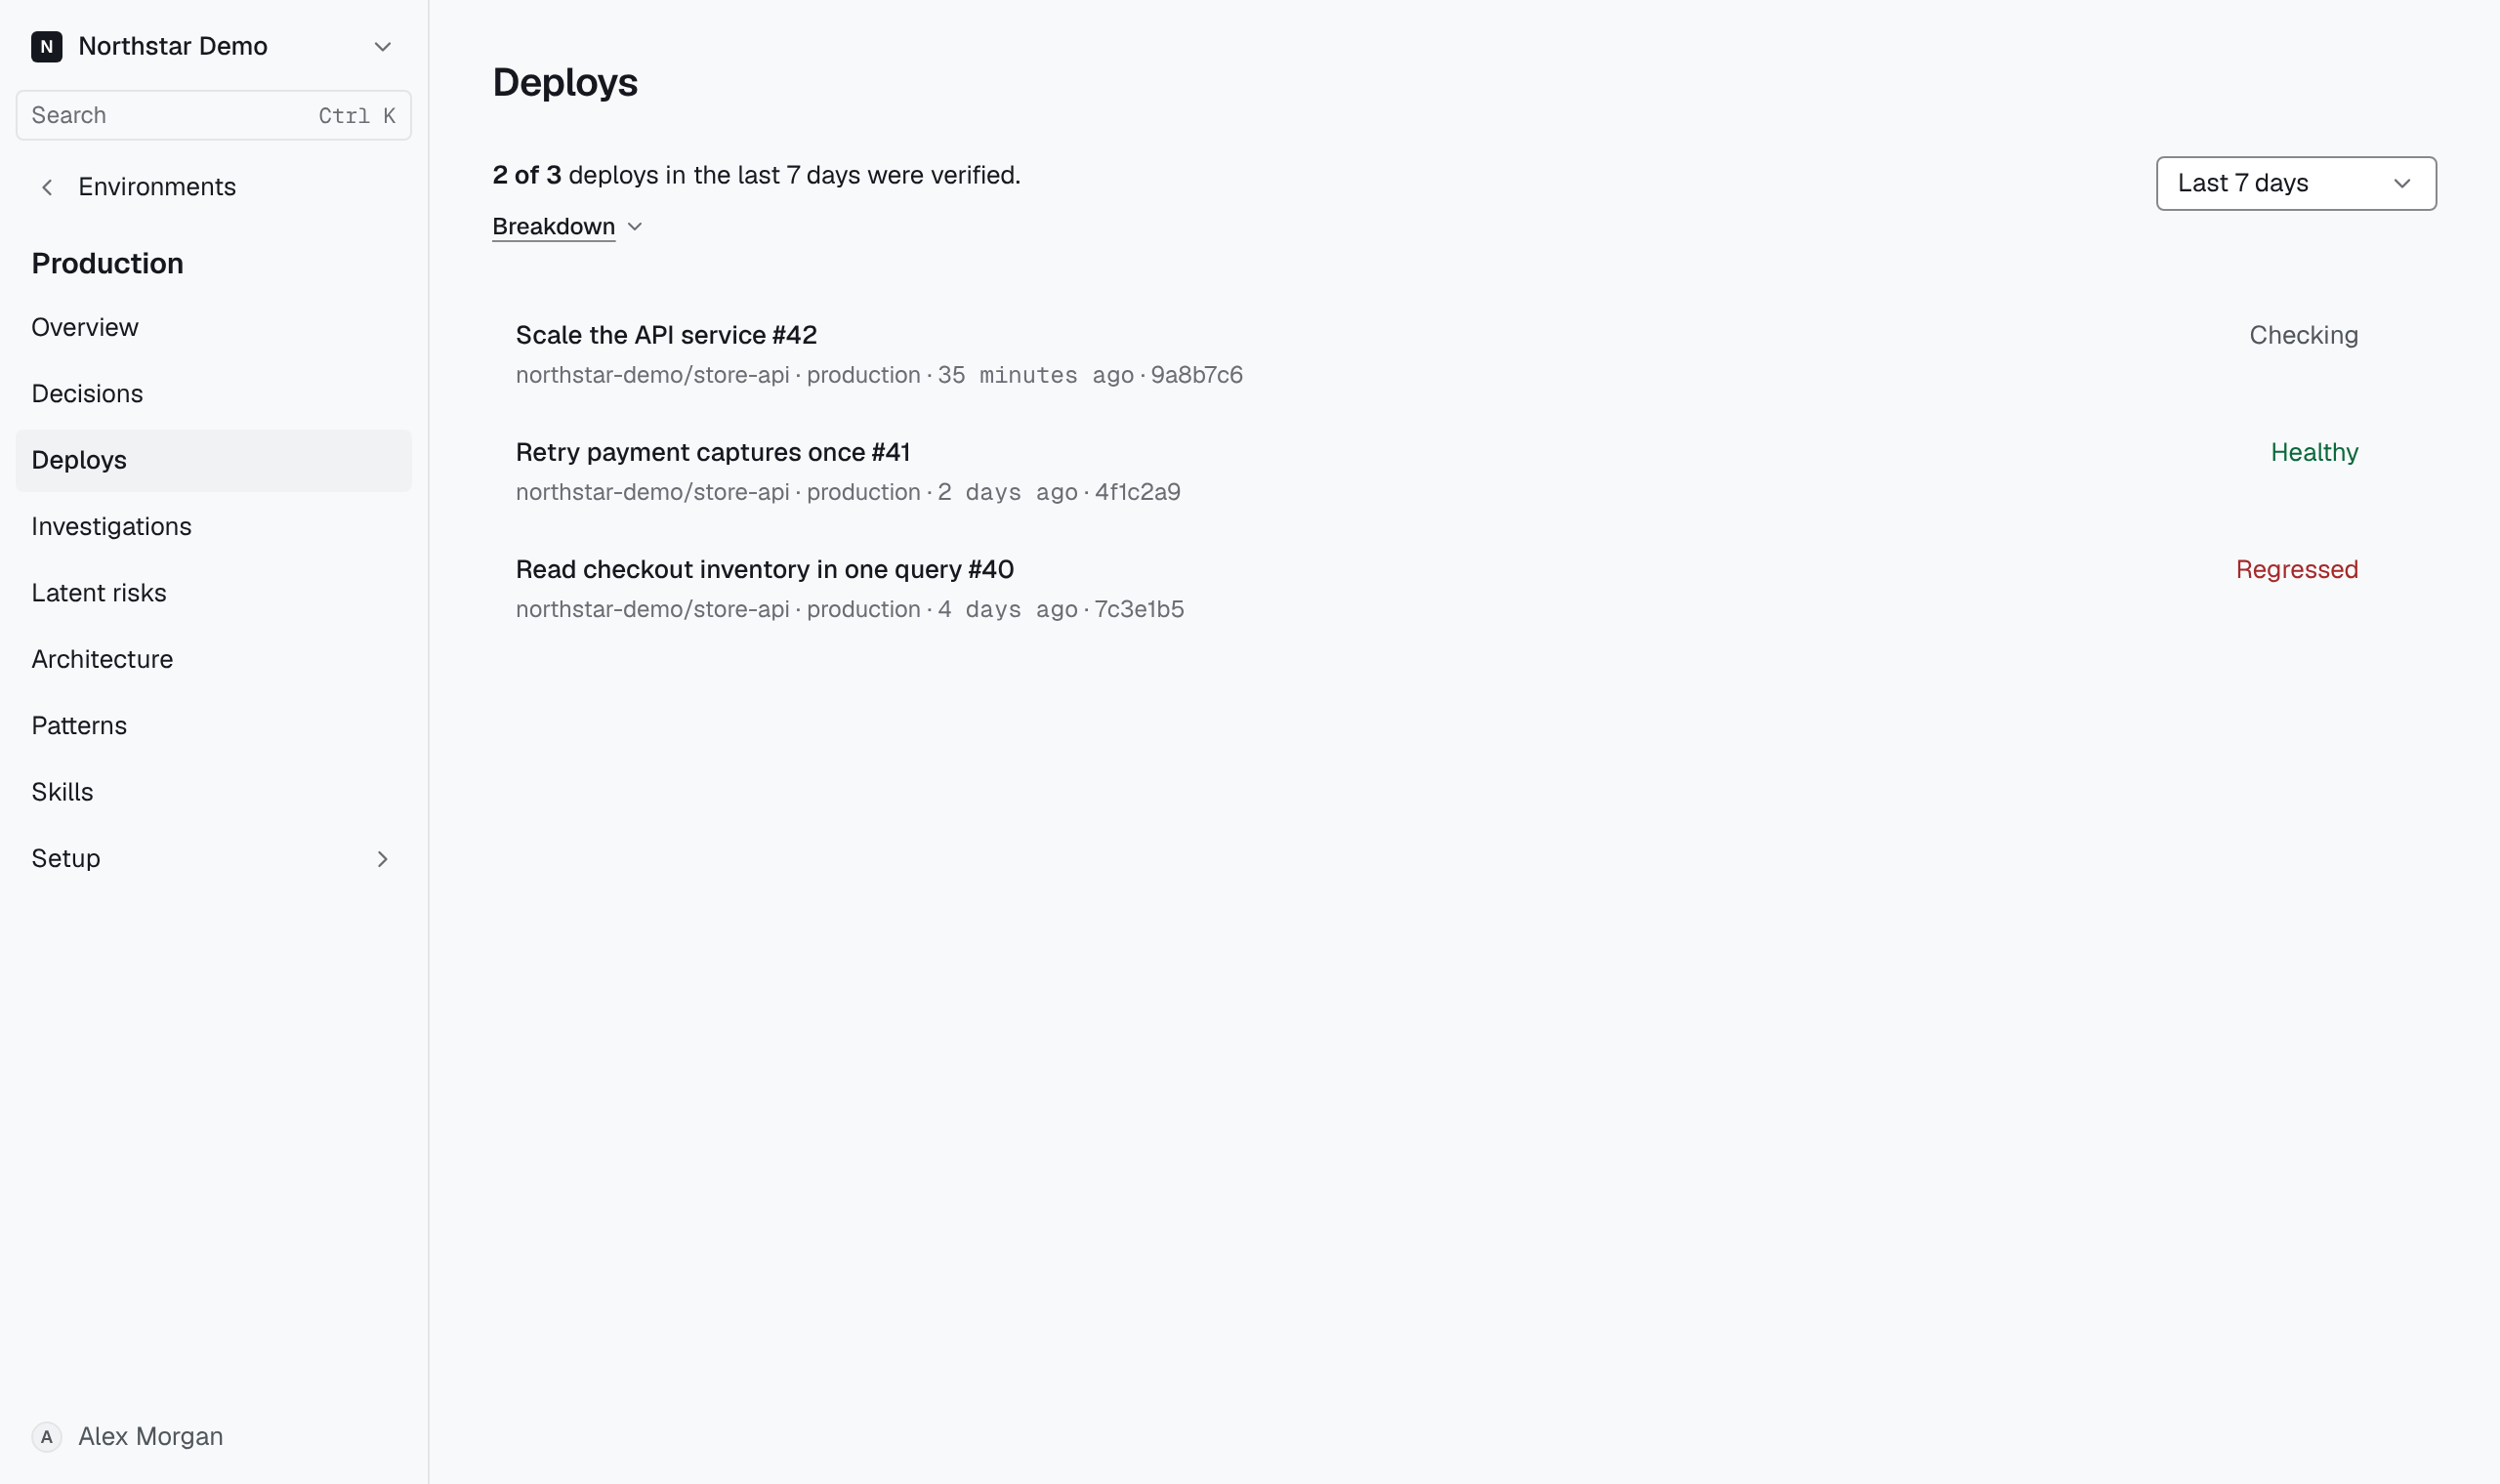
Filter the window and open a deployment#
The first line leads with what needs attention: how many deployments failed, then how many deploys regressed, then how many deploys had incomplete checks. When every deploy in the window went to one GitHub Environment or came from one AWS service, it then counts the window's verified deploys out of every deploy it holds, such as 9 of 22 deploys in the last 7 days were verified. Deploys verified until replaced count as verified. The line also says how many deploys had no signal to watch.
When the window holds deploys of more than one GitHub Environment, or AWS CodePipeline executions or AWS Amplify jobs, the first line gives no count over every deploy. Each group's count follows it instead, largest group first, labeled by its GitHub Environment, AWS CodePipeline executions or AWS Amplify jobs, such as 49 of 83 verified. Select a group's verified count to list that group's verified deploys. A GitHub Environment whose deploys change no runtime Proofline reads, such as a package publication, still counts: its deploys end incomplete, and it shows its own count beside the service's. An administrator also sees beside Breakdown the setup step that most of the window's gaps need, of the steps the Inbox still lists, such as Choose signals. When most incomplete deploys share the gap that step closes, a line above it names that gap once with its count.
Below the counts, an administrator can also see a linked repository whose GitHub deployments of the last 30 days landed no deploy, on a line that starts Not among the deploys recorded. Those deployments are outside the counts above, and the step under the line is Report deployment status or Choose GitHub Environments, which Deploy verification explains.
Select Breakdown for the count in each state below. An administrator also sees each gap a setup step closes, with how many incomplete deploys have it, and the step beside it while the Inbox lists that setup task, as Read what a gap leaves unestablished explains. A deploy belongs to the window that holds its landing, or its first recorded status when it never landed. Choose a group under Deploy group to list only its deploys, or All deploys to list every one. The counts above the list still describe the whole window.
Select the failed, regressed, incomplete or no-signal count in the first line, or a count in Breakdown, to list the deploys it counts. To narrow the list yourself, choose Failed, Regressed, Incomplete, Checking or not yet due or Verified under State, or Not set up when the window holds deploys that had no signal to watch. The page's address keeps the state, the deploy group and the window, so you can share a narrowed list. When no deploy matches, select Clear filters.
Deploys follow, newest first. Each is named by its pull request's title, else its commit's title, else its short commit. When the GitHub deployment named a tag or a branch, such as v0.3.5, it follows the name, so releases with the same title can be told apart. Below the name are the repository, the GitHub Environment and job or the AWS run that delivered it, when it landed and its short commit.