
Trace a browser action to its request and console output
The recording export joins different kinds of evidence with timestamps. Start with the moment the user saw the problem, especially if the session has unrelated warnings.
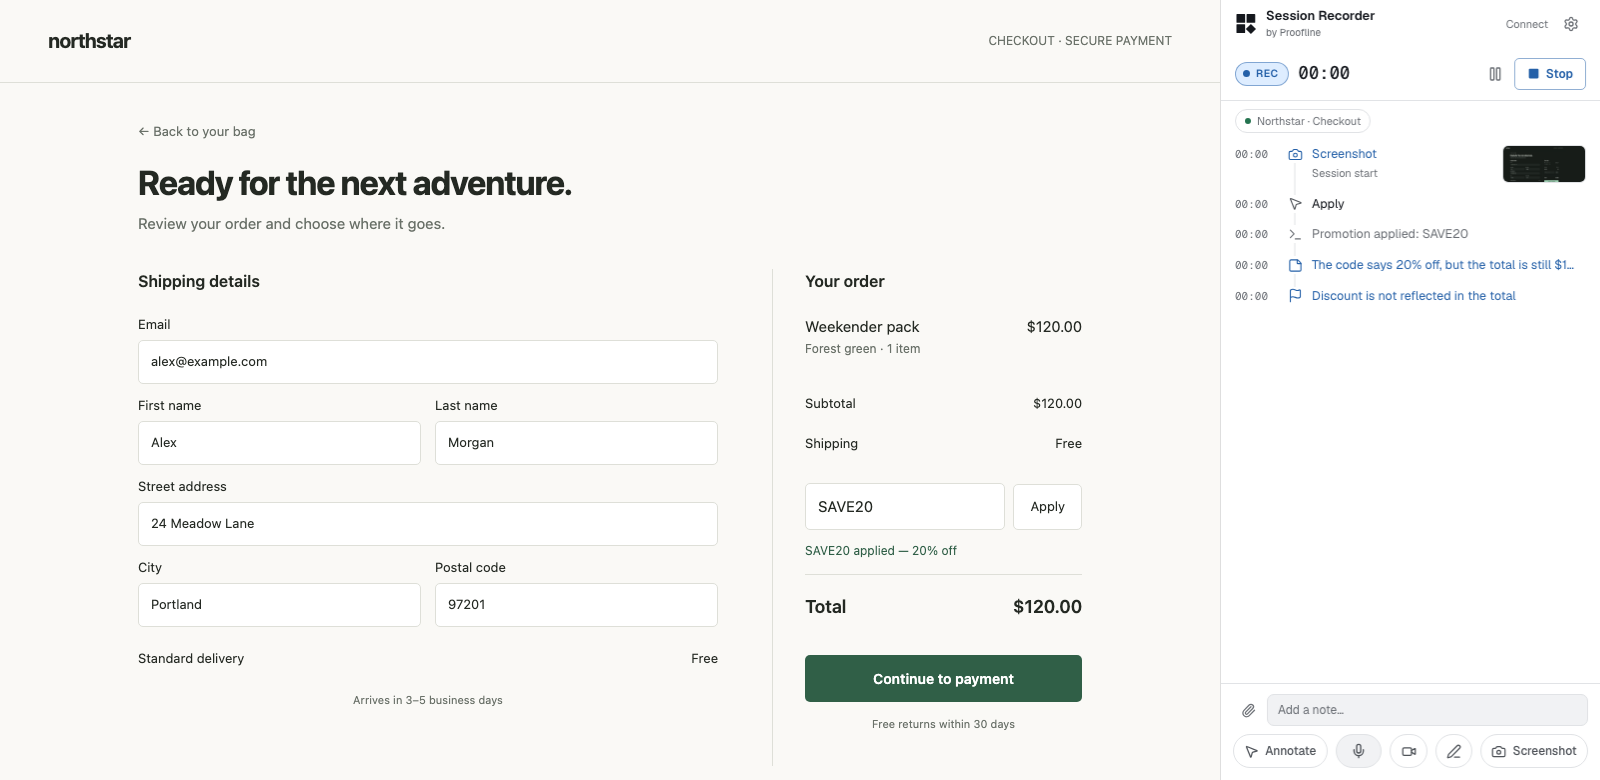
Follow a timestamp through the export#
Open report.md, find the annotation or narration that describes the failure and note its timestamp. Read the nearby interaction, request status and console messages in sequence.
Use session.json for structured events and MANIFEST.md to identify the included assets. If the body or frame you need is missing, check the chosen export level and the original capture settings.